 by
by Trending news reveals a groundbreaking interactive map of all 2.75 billion buildings on Earth, offering new technology insights into urban life, inequality, and internet culture.
A New Map That’s Capturing Internet Culture
In today’s fast-moving trending news cycle, few scientific releases manage to break out of academic circles and capture global attention. But a newly released interactive map showing every one of Earth’s 2.75 billion buildings has done exactly that—turning into one of the most talked-about viral stories online.
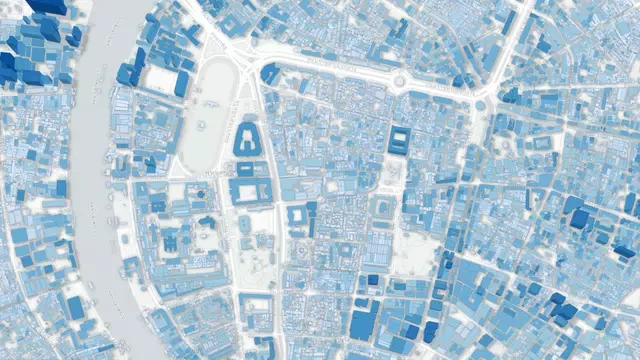
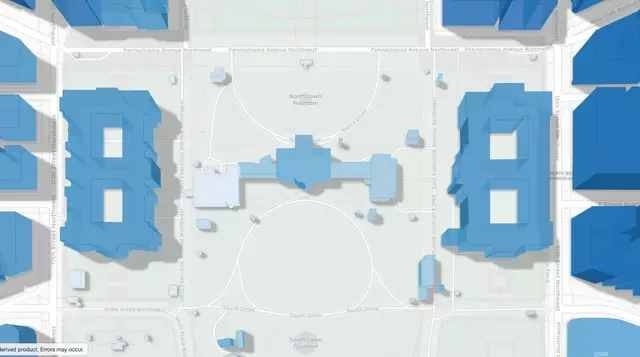
Created by researchers at the Technical University of Munich (TUM), the map doesn’t just outline cities. It visualizes nearly every physical structure on the planet, from towering megacities to isolated rural huts. For many users, the most startling moment comes when they zoom in and realize the tool can even show their own home.
The project, called GlobalBuildingAtlas, blends cutting-edge AI with satellite imagery, offering a fresh lens on how humans shape the planet—and how technology is reshaping the way we understand ourselves.

The Story Behind the GlobalBuildingAtlas
Mapping the Planet, One Building at a Time
The GlobalBuildingAtlas is now the largest building database ever created, containing roughly one billion more structures than any previous global dataset. According to the research team, the model delivers 30 times more detail than existing 3D building maps.
Using more than 800,000 satellite images from 2019, scientists trained machine-learning systems to distinguish buildings from roads, trees, and terrain. The result is a remarkably detailed 3D view of global development that estimates:
- Building height and volume
- Distance between neighboring structures
- Density patterns in both urban and rural regions
Unlike older mapping projects, this one didn’t rely on costly aircraft or ground-based scanning. Instead, it repurposed existing satellite data—showcasing how technology insights and AI can unlock new value from information already orbiting above us.
You can explore similar breakthroughs in science-driven viral stories in our Social Viral section:
Why This Map Went Viral on Social Media
A Social Media Phenomenon in Real Time
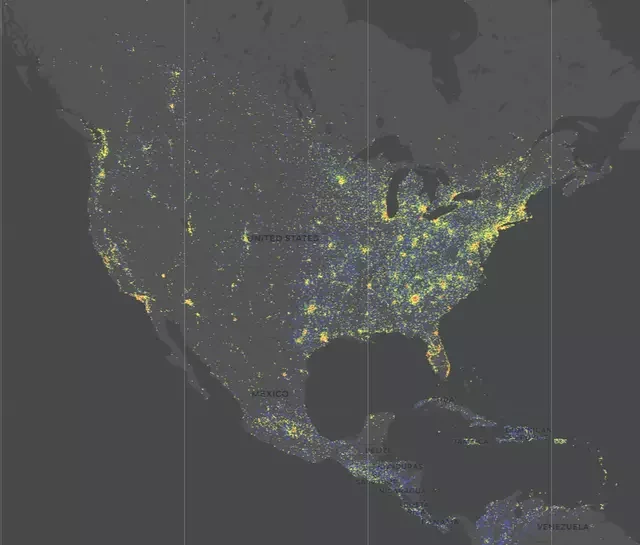
The release of the GlobalBuildingAtlas quickly evolved into a full-blown social media phenomenon. Within days, nearly 300,000 users visited the interactive platform, sharing screenshots and reactions across X, Reddit, and TikTok.
Part of the appeal lies in personalization. Internet users are naturally curious—and the ability to locate your own house within a global scientific model is irresistible. It’s the same curiosity that fuels popular digital entertainment experiences like Google Earth or viral ancestry tools.
But there’s also a deeper layer. Many creators began posting side-by-side comparisons of wealthy and poorer regions, sparking conversations about inequality, urban planning, and climate resilience. Science became shareable—not through charts, but through visuals that felt personal and immediate.
This mirrors a broader shift in internet culture, where complex data is increasingly packaged into interactive, user-driven experiences.
What It Reveals About Lifestyle Trends and Society
Buildings as a Mirror of How We Live
Beyond its technical achievements, the GlobalBuildingAtlas reveals striking patterns about modern lifestyle trends. According to the researchers, wealthier areas often feature:
- Larger buildings per person
- More open space between structures
- Greater overall building volume relative to population
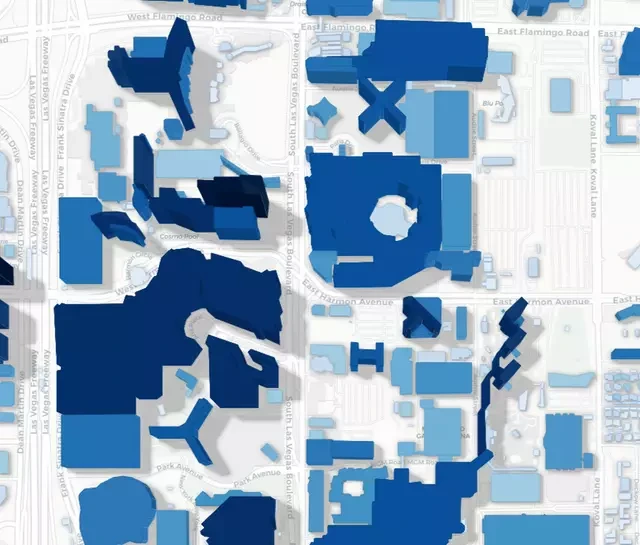
In contrast, denser regions with smaller structures often correlate with economic hardship. The team introduced a new global indicator—building volume per capita—to better capture these disparities.
“3D building information provides a much more accurate picture of urbanization and poverty than traditional 2D maps,” explained project lead Professor Xiaoxiang Zhu in statements reported by outlets such as The Guardian and BBC News.
This type of culture commentary shows how physical spaces reflect social realities. Our homes, neighborhoods, and cities aren’t just places to live—they’re data points that reveal how resources are distributed worldwide.
For more cultural deep dives into how trends shape daily life, explore our Lifestyle and Culture coverage:
Technology Insights: AI, Data, and the Future of Cities
How AI Is Redefining Global Planning
From a technology insights perspective, the project highlights AI’s expanding role in public policy and urban planning. Governments and researchers could use the data to:
- Improve disaster response for floods and earthquakes
- Plan more equitable housing developments
- Track urban sprawl and environmental impact
Because the dataset covers nearly the entire planet, it also offers new tools for studying climate change and habitat loss. As reported by Reuters, such models may help policymakers identify areas where human expansion threatens remaining wild spaces.
This marks a shift in how digital entertainment and serious science overlap. Interactive tools once built purely for exploration are now shaping real-world decisions.
You can read more about how technology drives viral conversations in our Tech & Trends section:
The Bigger Picture in Internet Culture
Why People Care So Much
At its core, the fascination with this map speaks to a larger trend in internet culture: people want to see themselves within global narratives. Whether it’s climate data, social inequality, or urban growth, tools that connect the personal with the planetary tend to resonate.
The GlobalBuildingAtlas does exactly that. It transforms abstract statistics—billions of buildings, millions of square miles—into something relatable. You’re not just reading about global development; you’re zooming in on it.
This blend of curiosity, technology, and storytelling is what turns serious research into shareable viral stories.
For more examples of how online trends shape conversation, check out our Entertainment and Social Viral sections:
Conclusion: A Map That Changes How We See the World
The release of a global map containing all 2.75 billion buildings on Earth is more than a scientific milestone—it’s a cultural moment. As trending news, it highlights how AI and interactive tools can transform complex research into experiences anyone can explore.
In an era defined by social media phenomenon moments and data-driven storytelling, the GlobalBuildingAtlas shows that even serious science can capture public imagination. It invites us to reflect on where we live, how we build, and what our shared spaces say about humanity’s future.
you can check it out HERE
Featured Image Credit: GlobalBuildingAtlas
Disclaimer:
This article is for informational and entertainment purposes only. The content reflects publicly available information and does not constitute professional or legal advice.